
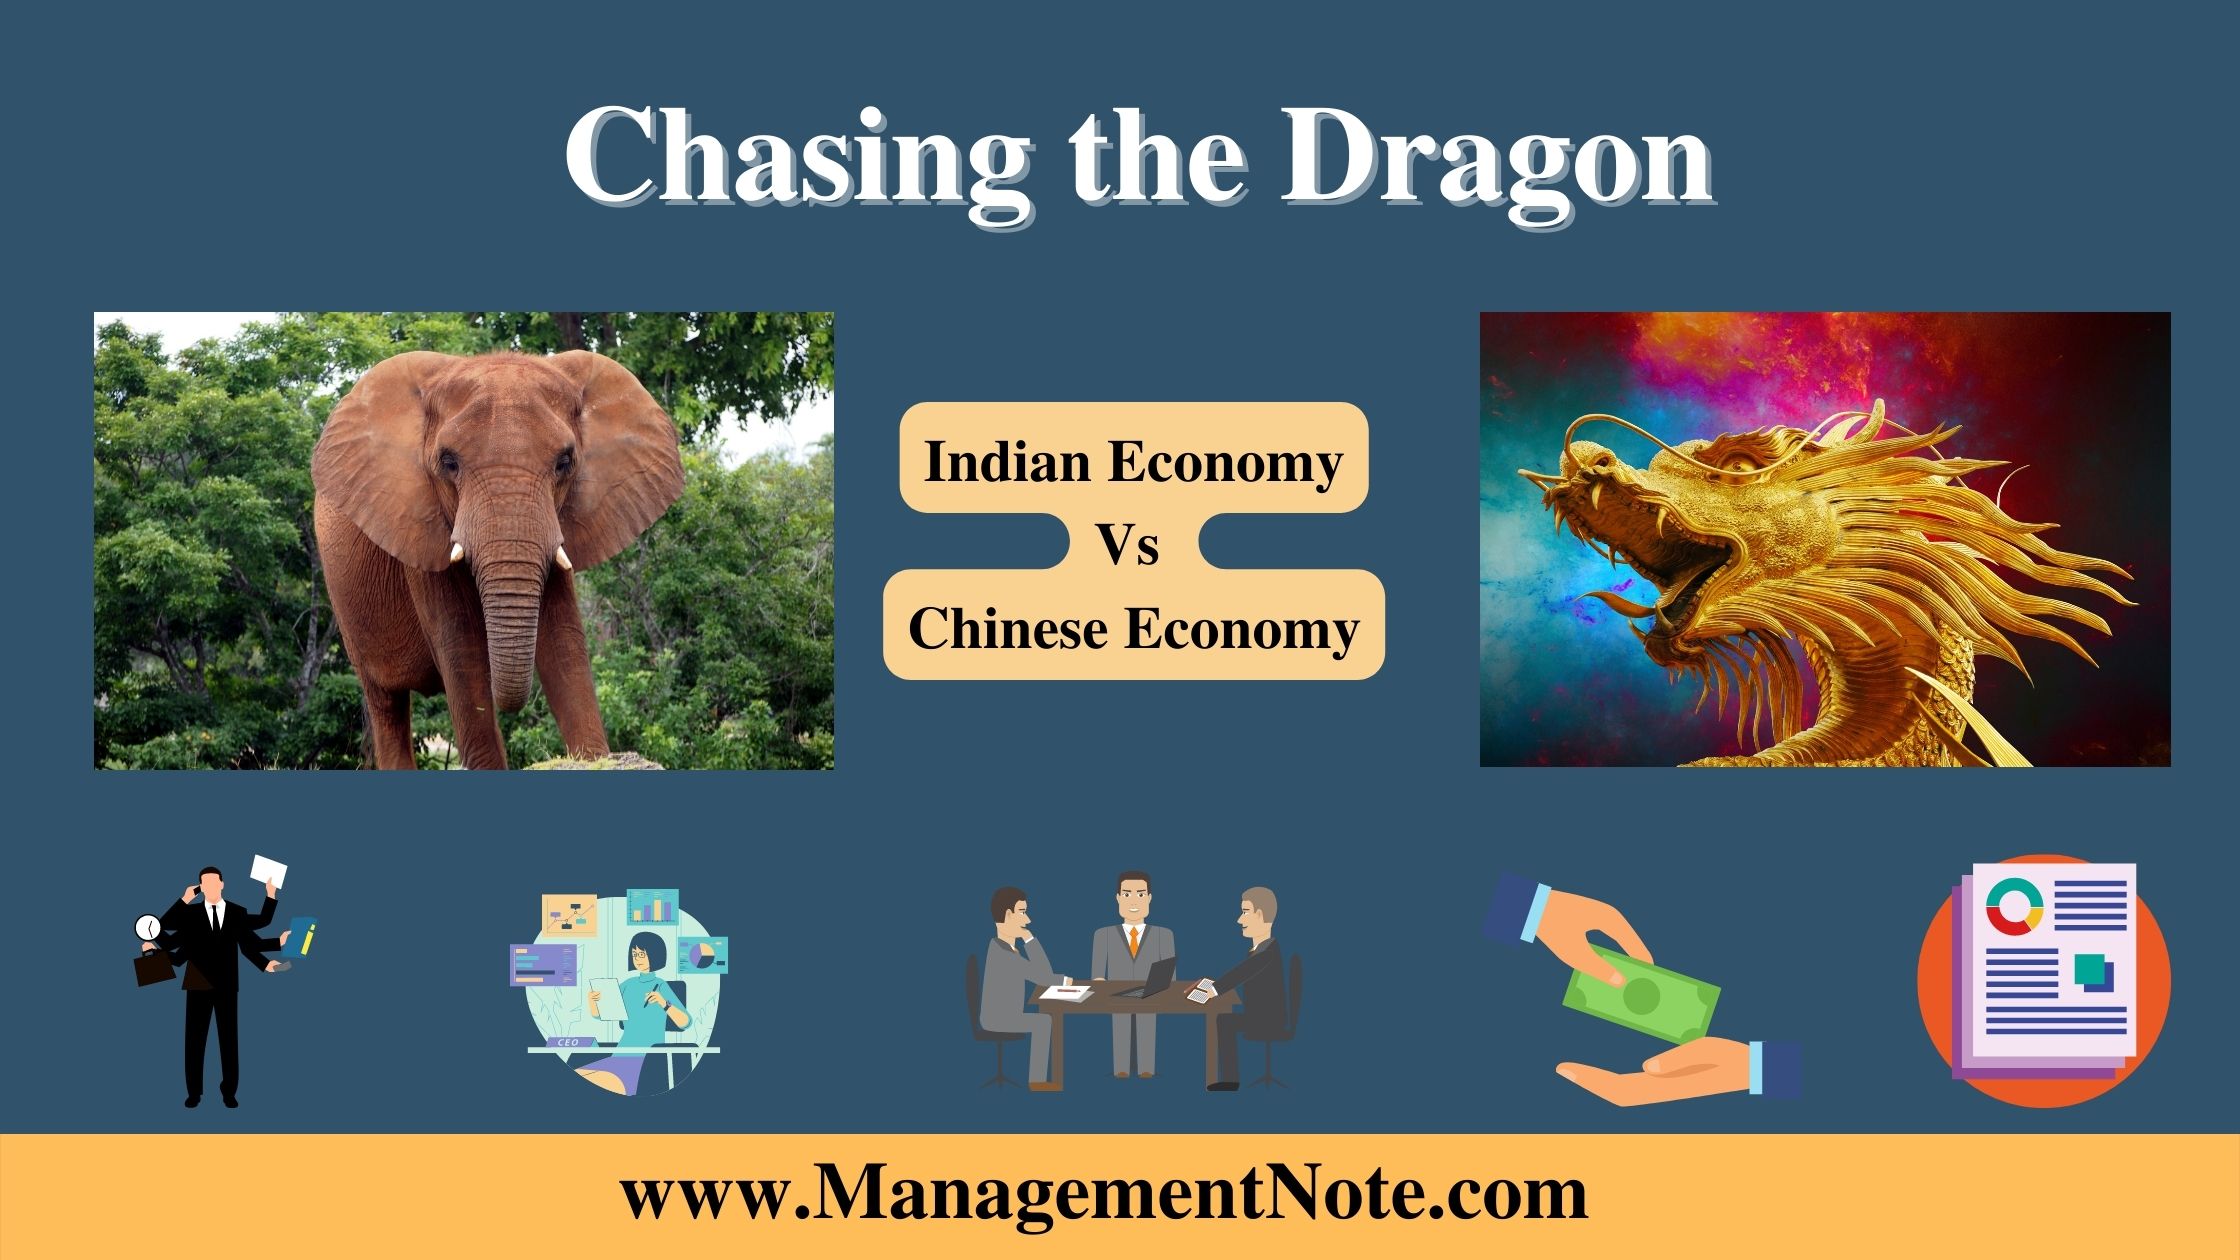
Elephant vs Dragon: India vs China Economy Comparison 2026 (GDP, Growth Rate, Infrastructure, Energy & More)
China’s economy is still much bigger than India’s in 2026. China’s GDP is about $20.85 trillion, while India’s GDP is about $4.15 trillion. That makes China’s economy roughly five times larger. But India is growing faster. India’s economy is expected to grow by about 6.5% this year, while China’s economy is expected to grow by about 4.8%.
This is why people call it “the Elephant chasing the Dragon.” The Elephant (India) moves slower in size, but it is picking up speed. The Dragon (China) is still much bigger, but its speed is slowing down.
This article breaks down the full comparison in simple words. It looks at GDP, growth rate, infrastructure, energy, water, government systems, population, and manufacturing. It also answers the most common questions people search for on this topic.
What Does “Chasing the Dragon” Mean in Economics?
“Chasing the Dragon” is a popular phrase. It first came from Hong Kong, where it described a way of using drugs. Over time, economists borrowed the phrase and gave it a new meaning. In economics, “Chasing the Dragon” now describes a country that is trying to catch up to a much bigger and faster-growing economy.
When people talk about India and China, they often use two animals as symbols:
- The Dragon stands for China. A dragon is a symbol of power and speed in Chinese culture.
- The Elephant stands for India. An elephant is large, strong, and steady, but it does not move as fast as a dragon is imagined to move.
So when someone says “the Elephant is chasing the Dragon,” they mean India’s economy is trying to catch up to China’s economy. India is growing, but China is still far ahead in total size.
This does not mean India’s growth is bad. It just means China had a big head start. India is now closing the gap slowly, year by year.
India vs China Economy: Key Numbers at a Glance (2026)
| Indicator | India | China | Who Leads |
|---|---|---|---|
| Nominal GDP (2026) | ~$4.15 trillion | ~$20.85 trillion | China |
| GDP (PPP basis, 2026) | ~$18.9 trillion | ~$44.3 trillion | China |
| GDP growth rate (2026 est.) | ~6.5% (IMF: 6.4%; RBI: up to 7.3%) | ~4.8% | India |
| GDP per capita (nominal) | ~$2,813 | ~$14,874 | China |
| World ranking by nominal GDP | 6th | 2nd | China |
| Population (2026) | ~1.46 billion | ~1.41 billion | India |
| Urban population share | ~37% | ~65% | China |
| Manufacturing share of GDP | ~14–17% | ~27–28% | China |
| Renewable energy capacity | ~280–288 GW | ~2,258+ GW | China |
| Solar power capacity | ~165 GW | ~1,286 GW | China |
| Government debt (% of GDP) | ~83.4% | Higher, rising | Mixed |
| Political system | Federal democracy | One-party, centralized | — |
Sources: IMF World Economic Outlook 2026, World Bank, StatisticsTimes.com, IRENA Renewable Energy Statistics 2026, RBI, Ministry of New and Renewable Energy (India).
This table gives you the full picture in one look. Below, we explain each point in detail, section by section, with its own summary table.
1) GDP and GDP Per Capita: India vs China
Gross Domestic Product, or GDP, tells us the total value of everything a country produces in one year. GDP per capita divides that number by the population, showing the average income level per person.
India’s GDP Story
- India’s GDP has grown steadily over the past decades.
- In 2026, India’s nominal GDP stands at around $4.15 trillion, making it the world’s 6th largest economy.
- India’s GDP per capita is around $2,813, which is still low compared to developed nations.
- India is on track to overtake Japan and move into the top 4 economies in the near future, based on IMF projections.
- The rise in GDP per capita reflects growing trade, government spending on welfare and infrastructure, and a fast-expanding digital economy (like UPI digital payments).
China’s GDP Story
- China’s nominal GDP in 2026 is around $20.85 trillion, the 2nd largest in the world after the United States.
- On a Purchasing Power Parity (PPP) basis, which adjusts for the cost of living, China’s economy is actually the largest in the world, at around $44.3 trillion.
- China’s GDP per capita is around $14,874, which is over five times higher than India’s.
- China crossed the $1 trillion GDP mark in 1998. India took nine more years to reach the same mark, hitting it in 2007.
- In 1987, India and China had almost equal GDP. Today, China’s economy is nearly five times bigger.
Why the Gap Grew So Large
China opened its economy to global trade and manufacturing earlier and more aggressively than India. It focused heavily on exports, factories, and infrastructure from the 1980s and 1990s onward. India opened its economy later, in 1991, and has grown in a different way — driven more by services like IT and software than by factories.
Summary Table: GDP and GDP Per Capita
| Metric | India (2026) | China (2026) |
|---|---|---|
| Nominal GDP | ~$4.15 trillion | ~$20.85 trillion |
| GDP (PPP) | ~$18.9 trillion | ~$44.3 trillion |
| GDP per capita (nominal) | ~$2,813 | ~$14,874 |
| Nominal GDP world rank | 6th | 2nd |
| PPP GDP world rank | 3rd | 1st |
| Year GDP crossed $1 trillion | 2007 | 1998 |
| Historic highest GDP growth (single year) | 9.69% (2021) | 19.30% (1970) |
| Historic lowest GDP growth (single year) | -5.78% (2020) | -27.27% (1961) |
2) GDP Growth Rate: Who Is Growing Faster in 2026?
While China’s economy is bigger, India’s economy is growing at a faster rate in 2026.
- The IMF projects India’s GDP growth at around 6.4% to 6.6% for 2025–26.
- The Reserve Bank of India (RBI) is even more optimistic, projecting growth up to 7.3% for FY26.
- China’s GDP growth is projected at around 4.8% for the same period, and it is expected to slow further to around 4.0–4.5% in the next year.
- India has held the title of the “world’s fastest-growing major economy” for several years in a row.
- Even so, China’s economy is so large that it still contributes more to total global economic growth. Together, India and China account for about 43.6% of global GDP growth in 2026, with China contributing more than India in absolute terms.
Why Did China Grow Faster in the Past?
China’s rapid growth in earlier decades came from adopting new technology and industrial methods quickly. Once an economy reaches its “technological frontier” (meaning it has already adopted most of the modern technology and methods available), growth naturally slows down. This is happening in China now.
India, on the other hand, is still catching up to that frontier. Economists believe this gives India more room to keep growing at a fast pace in the coming years, because it still has many technologies and efficiencies left to adopt.
Summary Table: GDP Growth Rate Comparison
| Metric | India | China |
|---|---|---|
| GDP growth rate (2026, IMF est.) | ~6.4–6.6% | ~4.8% |
| GDP growth rate (2026, RBI est.) | Up to 7.3% | — |
| Growth forecast for next year | ~6.2–6.4% | ~4.0–4.5% |
| Share of global GDP growth (2026) | ~17% | ~26.6% (combined ~43.6%) |
| Status | World’s fastest-growing major economy | World’s largest contributor to global growth (in absolute size) |
| Stage of development | Still below technological frontier (more room to grow) | Closer to technological frontier (growth naturally slowing) |
3) Infrastructure Investment: Why China Built Faster
Infrastructure means the basic physical systems a country needs to function — roads, railways, ports, airports, power plants, and telecom networks. Strong infrastructure supports business growth and job creation.
- China has historically invested a much higher share of its GDP into infrastructure and capital projects — commonly cited at around 8–9% of GDP, compared to India’s roughly 3–5%.
- China invested more in infrastructure than any other country in recent years, spending heavily on transportation, industrial parks, housing, and digital infrastructure.
- China’s infrastructure investment is forecast to reach $1.7–1.9 trillion in upcoming years.
- India’s National Infrastructure Pipeline (NIP) targets around $1.4 trillion in infrastructure spending, with total investment needs estimated at $4.5 trillion by 2040 to catch up with rising demand.
- India is now the second-largest infrastructure market in Asia after China.
Why This Matters
When a government builds roads, ports, and power supply quickly, factories can operate more efficiently, and goods can move faster to markets. This lowers business costs and attracts more foreign investment. China’s head start in infrastructure gave its factories and exporters a big cost advantage over the years.
India is now closing this gap. Investment in highways, railways, ports, and digital infrastructure like 5G and UPI payments has increased sharply in the last decade.
Summary Table: Infrastructure Investment
| Metric | India | China |
|---|---|---|
| Infrastructure investment (% of GDP, approx.) | ~3–5% | ~8–9% |
| Recent infrastructure spending plans | ~$1.4 trillion (NIP) | ~$1.7–1.9 trillion (forecast) |
| Long-term infrastructure need | ~$4.5 trillion by 2040 | ~$28 trillion gap by 2040 (largest in the world) |
| Ranking in Asia (infra investment need) | 2nd largest after China | Largest in Asia |
4) Energy: Who Is Winning the Clean Energy Race?
Energy security is a major factor behind economic growth. A country needs reliable and affordable power to run factories, homes, and offices.
China’s Energy Position
- China leads the world in total renewable energy capacity, with more than 2,258 GW installed as of 2026.
- China’s solar power capacity alone stands at about 1,286 GW, making it by far the world’s largest solar producer.
- In 2025, China’s solar power generation capacity overtook coal-fired capacity for the first time in history — a major turning point for the country’s energy mix.
- China commissioned nearly 370 GW of new solar capacity and 117 GW of new wind capacity in a single recent year, accounting for more than 60% of the world’s new renewable capacity additions.
India’s Energy Position
- India ranks 3rd in the world for total renewable energy capacity, at around 280–288 GW as of mid-2026.
- India’s installed solar capacity reached about 165 GW by mid-2026, up from just 2.8 GW in 2014 — a massive jump in just over a decade.
- India added a record 44.6 GW of new solar capacity in a single financial year, beating its own government target.
- In June 2026, India overtook the United States in annual solar capacity additions, though it remains far behind China in total scale.
- India still depends heavily on imported oil and coal for a large part of its total energy needs, which affects its trade balance.
Summary Table: Energy Comparison
| Metric | India (2026) | China (2026) |
|---|---|---|
| Total renewable energy capacity | ~280–288 GW | ~2,258+ GW |
| Solar power capacity | ~165 GW | ~1,286 GW |
| World rank in renewable capacity | 3rd | 1st |
| Recent solar milestone | Overtook the US in annual solar additions (2026) | Solar capacity overtook coal capacity (2025) |
| Main energy challenge | Heavy dependence on oil/coal imports | Still relies on coal for base-load power despite solar growth |
5) Water Resources: A Story of Scarcity, Not Abundance
Water plays a hidden but critical role in a country’s food security and industrial output.
- India is home to about 18% of the world’s population but has only about 4% of the world’s freshwater resources — a major imbalance.
- India’s per capita water availability has fallen sharply, from about 5,177 cubic metres per person in 1951 to around 1,400–1,486 cubic metres today.
- If per capita availability falls below 1,000 cubic metres, a country is officially classified as “water-scarce.” India is edging closer to that line.
- Agriculture uses about 85–90% of India’s total freshwater, mostly for water-heavy crops like rice and sugarcane, even in dry regions.
- Around 14–17% of India’s groundwater assessment blocks are officially “over-exploited,” especially in states like Punjab, Haryana, and Rajasthan.
- Nearly 70% of India’s surface water sources are contaminated, adding to the scarcity problem.
China, while also facing water stress in its northern regions, has invested heavily in water management systems, large-scale water transfer projects, and stricter penalties for industrial water pollution and groundwater overuse.
This systematic management approach has helped Chinese agriculture and industry use water resources more efficiently than in India, despite China having a similar or smaller freshwater endowment relative to its population in some regions.
Summary Table: Water Resources
| Metric | India | China |
|---|---|---|
| Share of world’s freshwater | ~4% | Higher per capita but regionally stressed |
| Share of world’s population | ~18% | ~17% |
| Per capita water availability (recent) | ~1,400–1,486 m³/year | Regionally variable; stressed in north China |
| Water-stress threshold | 1,700 m³/year | 1,700 m³/year |
| Main water use sector | Agriculture (85–90%) | Agriculture and industry |
| Key challenge | Groundwater over-extraction, pollution, poor storage | Regional imbalance, industrial pollution |
6) Political and Governance System: Speed Vs Consultation
- China follows a one-party, centralized political system led by the Chinese Communist Party. Decisions on land acquisition, infrastructure projects, and industrial policy can move quickly because there are fewer layers of approval.
- India is a federal democracy with a central government, state governments, and local bodies. Major decisions often need approval from multiple levels of government, which can slow down large projects.
- A well-known example is India’s Goods and Services Tax (GST) reform, which took many years of political negotiation before it was finally passed, showing how consultation-heavy the Indian system can be.
- On the other hand, India’s democratic system provides more checks and balances, judicial oversight, and public accountability, which many economists view as a long-term strength for stability and rule of law.
Recent Reform Push in India
In recent years, India has taken several steps to make it easier for both domestic and foreign companies to do business:
- Foreign Direct Investment (FDI) rules have been relaxed, allowing 100% foreign ownership in most sectors.
- India signed new trade agreements, including the India-EFTA Trade and Economic Partnership Agreement (TEPA), covering over 92% of tariff lines, along with deals with the UAE, UK, and EU.
- India’s total merchandise and services exports reached close to $790.86 billion in a recent financial year, growing by nearly 5.79%.
- India’s ranking in the World Bank’s “Ease of Doing Business” index improved sharply, from 142nd in 2014 to 63rd in 2019 (the last year the index was published).
Summary Table: Political System and Business Environment
| Metric | India | China |
|---|---|---|
| Political system | Federal democracy | One-party centralized state |
| Decision-making speed | Slower (multi-level approvals) | Faster (centralized approvals) |
| FDI ownership allowed | 100% in most sectors | Restricted in several sectors |
| Ease of Doing Business rank (last published) | 63rd (2019, up from 142nd in 2014) | Ranked higher historically, index discontinued in 2021 |
| Key strength | Legal checks, democratic accountability | Speed of execution |
7) Population and Urbanization: The Demographic Story
- India became the world’s most populous country in 2023, and by 2026 its population stands at around 1.46 billion, compared to China’s roughly 1.41 billion.
- India’s population is still growing slowly, while China’s population has already started to shrink slightly year on year.
- India has a much younger population, with a median age under 30. This is often called India’s “demographic dividend” — a large and growing working-age population that will not peak until around the 2050s.
- China’s population is aging quickly, similar to Japan and parts of Europe, which creates long-term challenges for its labor force and pension system.
Urbanization: China’s Big Advantage
- In 1950, India was actually more urbanized than China (17% vs 13%).
- By 2026, China’s urban population share has grown to around 65%, while India’s stands at around 37%.
- Urban areas generally pay higher wages and offer more industrial and service-sector jobs, encouraging people to move away from farming.
- China’s faster urban shift helped fuel its factory-driven growth model, while India’s urban transition has been slower and less centrally planned.
Summary Table: Population and Urbanization
| Metric | India (2026) | China (2026) |
|---|---|---|
| Total population | ~1.46 billion | ~1.41 billion |
| Population trend | Still growing | Slowly shrinking |
| Median age | Under 30 | Rising, aging population |
| Urban population share | ~37% | ~65% |
| Urban share in 1950 | ~17% (higher than China) | ~13% |
8) Manufacturing and Trade: The Factory of the World Vs the Rising Challenger
- Manufacturing makes up about 27–28% of China’s GDP, making it the undisputed “factory of the world.”
- In India, manufacturing has stayed largely stuck between 14% and 17% of GDP for over three decades, despite government targets to raise it to 25%.
- India’s government launched the Production-Linked Incentive (PLI) scheme in 2020, covering 14 sectors including electronics, pharmaceuticals, and semiconductors, with a total outlay of about ₹1.97 lakh crore (roughly $23–24 billion).
- The PLI scheme has driven strong FDI growth. Manufacturing FDI equity inflows rose about 69%, climbing from around $97.7 billion (2004–2014) to about $165.1 billion (2014–2024).
- Many global companies are following a “China+1” strategy — keeping a base in China but adding a second manufacturing base, often in India, Vietnam, or other countries, to reduce supply chain risk.
- Despite this progress, India’s manufacturing sector still makes up a small share, around 2.8%, of global manufacturing output, compared to China’s dominant global share.
Summary Table: Manufacturing and Trade
| Metric | India | China |
|---|---|---|
| Manufacturing share of GDP | ~14–17% | ~27–28% |
| Global manufacturing share | ~2.8% | Dominant (largest globally) |
| Key government scheme | PLI Scheme (₹1.97 lakh crore, 14 sectors) | Long-established export & industrial policy |
| Manufacturing FDI trend | Rising sharply (+69% over a decade) | Diversifying amid “China+1” shift |
| Global investment trend | Benefiting from “China+1” strategy | Facing gradual supply-chain diversification |
Master Summary Table: India vs China Economy (All Categories, 2026)
| Category | India | China | Advantage |
|---|---|---|---|
| Nominal GDP | ~$4.15 trillion | ~$20.85 trillion | China |
| GDP growth rate | ~6.4–7.3% | ~4.8% | India |
| GDP per capita | ~$2,813 | ~$14,874 | China |
| Infrastructure investment (% GDP) | ~3–5% | ~8–9% | China |
| Renewable energy capacity | ~280–288 GW | ~2,258+ GW | China |
| Solar capacity | ~165 GW | ~1,286 GW | China |
| Freshwater availability | Highly scarce, ~1,400 m³/capita | Regionally stressed but larger overall base | China |
| Political decision-making speed | Slower, multi-layered | Faster, centralized | China |
| Ease of doing business trend | Improving rapidly | Historically strong, less transparent recently | Mixed |
| Population | ~1.46 billion (growing, young) | ~1.41 billion (shrinking, aging) | India |
| Urbanization rate | ~37% | ~65% | China |
| Manufacturing share of GDP | ~14–17% | ~27–28% | China |
| Global growth contribution (2026) | ~17% | ~26.6% | China |
Bottom line: China remains the larger and more industrially developed economy across almost every measure in 2026. But India holds a clear lead in growth rate, population strength, and demographic potential — the exact ingredients that could allow the “Elephant” to keep closing the gap with the “Dragon” in the years ahead, even if it does not overtake it soon.
Frequently Asked Questions
Is India’s economy catching up to China’s economy?
India’s economy is growing faster than China’s in percentage terms, but China’s economy is still about five times larger in total size. At current trends, most economists believe it will take many decades for India to close the total GDP gap with China, even though India is the faster-growing economy today.
Why is China’s economy bigger than India’s?
China opened up to global trade and heavy industrial investment earlier than India, invested a much larger share of its GDP into infrastructure, urbanized faster, and built a massive manufacturing base that made it the “factory of the world.” India opened its economy later (1991) and grew more through services like IT rather than large-scale manufacturing.
Will India ever overtake China’s economy?
Most economic forecasts do not expect India to overtake China’s total GDP in the near or medium term, given the current gap of nearly $16.7 trillion in nominal terms. However, India is expected to become the world’s third-largest economy in nominal terms within the next few years, moving past Japan and Germany, while still trailing the US and China.
What does “Elephant vs Dragon” mean in the India-China economy comparison?
“Elephant vs Dragon” is a popular way of describing India (the Elephant) and China (the Dragon) as they compete for global economic influence. It reflects India’s slower but steady growth style compared to China’s historically explosive, centrally-driven growth.
Which country has better growth potential, India or China?
India has a younger population, rising urbanization, and has not yet reached its “technological frontier,” giving it more room for high growth in the coming decades. China’s population is aging and shrinking, and its growth is naturally slowing as its economy matures. Many economists see India’s demographic dividend as its biggest long-term advantage.
Is India’s GDP growth rate higher than China’s in 2026?
Yes. In 2026, India’s GDP growth rate is projected at around 6.4% to 7.3% depending on the source (IMF vs RBI estimates), while China’s GDP growth rate is projected at around 4.8%, making India the world’s fastest-growing major economy this year.
How does India’s manufacturing sector compare to China’s?
China’s manufacturing sector makes up around 27–28% of its GDP and dominates global manufacturing output. India’s manufacturing sector has remained around 14–17% of GDP for the past three decades, though government schemes like PLI and the “China+1” trend are pushing it slowly upward.
Conclusion
The comparison between India and China is often summed up by the “Elephant vs Dragon” idea, and the numbers in 2026 still support that picture. China’s Dragon economy remains far larger, with stronger infrastructure, energy capacity, and manufacturing output.
But India’s Elephant is not standing still. It is now the fastest-growing major economy in the world, backed by a young and growing population, expanding renewable energy capacity, rising foreign investment, and gradual reforms to make business easier.
China’s growth engine is slowing down as its population ages and its economy matures past its technological frontier. India, on the other hand, still has a long runway of growth ahead of it.
The Dragon is not about to be overtaken soon — but the Elephant is picking up speed, and the gap, while still wide, is no longer widening as fast as it once was.

MBA- Finance Specialization
I am Smirti Bam, an enthusiastic edu blogger with a passion for sharing insights into the dynamic world of business and management through this website.
I hold a MBA degree from Presidential Business School, Kathmandu, and a BBA degree with a specialization in Finance from Apex College,
- Moonlighting Vs Freelancing: Meaning, Differences & Risks Explained | Human Resource Management (HRM) - September 14, 2026
- Employee Retention Vs. Employee Engagement: Key Differences Explained | Human Resource Management - September 6, 2026
- Talent Acquisition Vs Talent Management: What Is the Difference? - September 2, 2026


