
Earnings Per Share (EPS): What It Is, How to Calculate It, and Why It Matters | Accounting Management
What Is Earnings Per Share (EPS)?
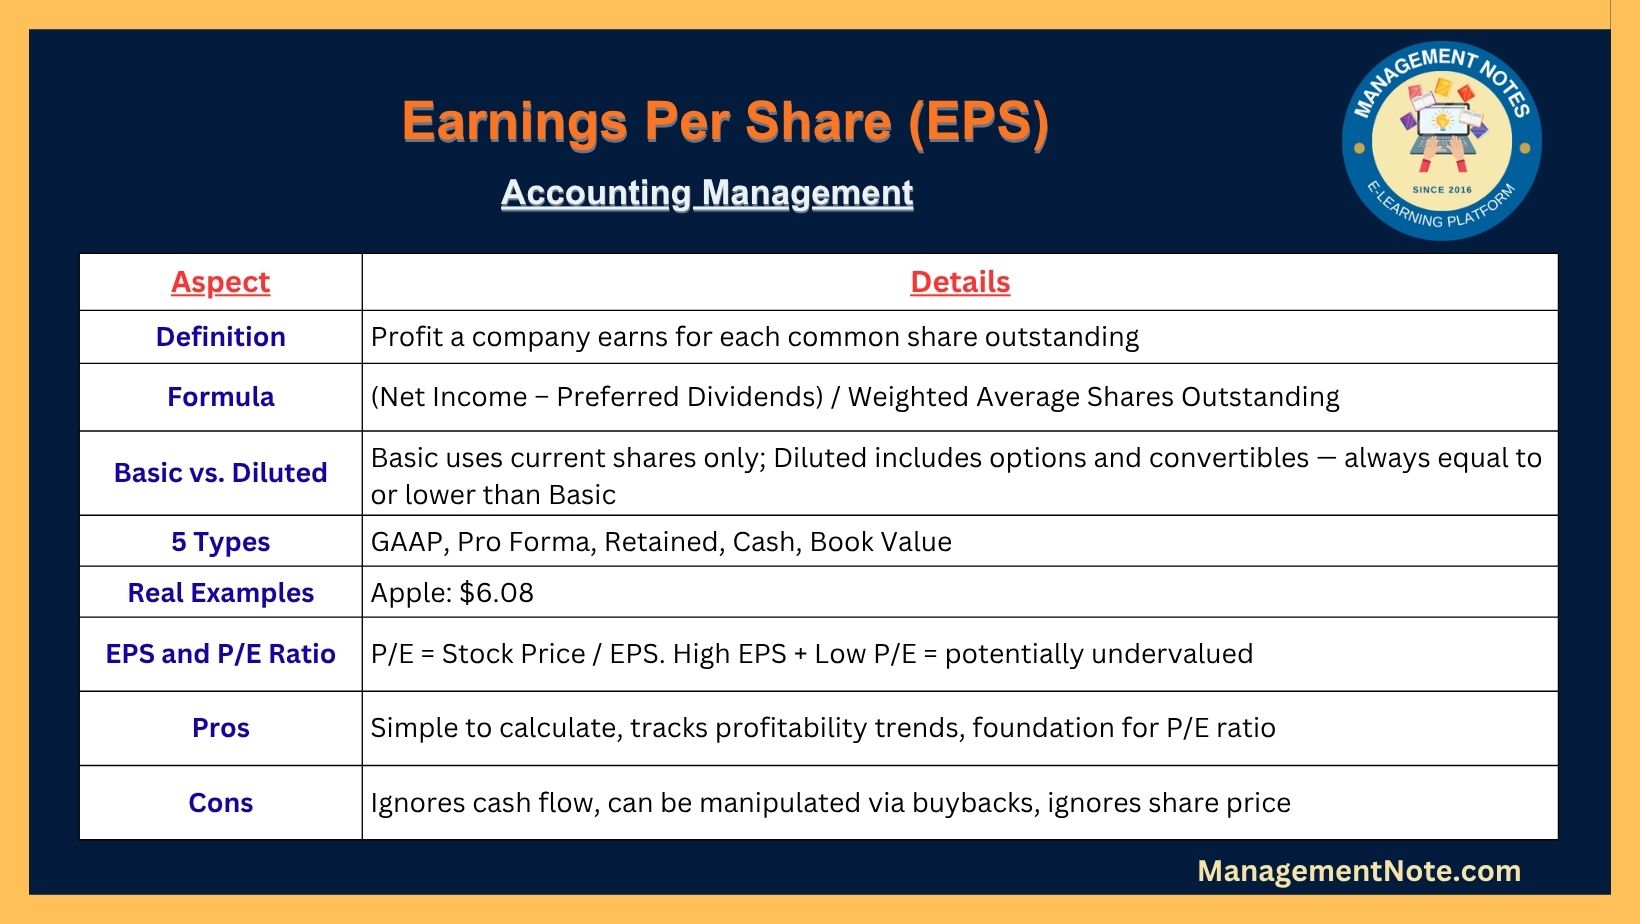
Earnings per share (EPS) is a financial metric that shows how much profit a company earns for every share of its common stock. It is one of the most widely watched numbers during earnings season and is a required disclosure for all public companies under SEC reporting rules.
EPS is one of the most direct links between a company’s profitability and shareholder value. For investors, it is often the starting point for evaluating whether a stock is fairly priced, overvalued, or undervalued.
Think of it this way: if a company’s total profit is a pie, EPS tells you exactly how large each shareholder’s slice is. The bigger the slice, the more profitable the company is on a per-share basis.
Public companies in the United States are required to report EPS on their income statements, making it a baseline disclosure for regulators and shareholders.
EPS Formula: How to Calculate It
There are two standard formulas used to calculate EPS:
Basic EPS Formula
Basic EPS = (Net Income – Preferred Dividends) / Weighted Average Common Shares Outstanding
Weighted EPS Formula
Weighted EPS = (Net Income After Tax – Total Dividends) / Total Number of Outstanding Shares
To calculate EPS, you need two items from a company’s financial statements:
- Net income (from the income statement)
- Weighted average shares outstanding (from the balance sheet or notes)
Why use the weighted average? The number of shares can change during the year due to stock buybacks or new share issuances. Using a weighted average gives a more accurate picture across the full reporting period.
Basic EPS vs. Diluted EPS
| Feature | Basic EPS | Diluted EPS |
|---|---|---|
| Definition | Profit divided by current shares outstanding | Profit divided by shares + all potential shares |
| Includes stock options? | No | Yes |
| Includes convertible bonds? | No | Yes |
| More conservative? | No | Yes |
| Best used for | Quick snapshot | Worst-case scenario analysis |
Diluted EPS is generally considered the more reliable number. It accounts for all securities that could convert into common shares, such as employee stock options, warrants, and convertible bonds. Because it assumes a higher share count, diluted EPS is always equal to or lower than basic EPS.
There are two versions investors will commonly see: basic EPS and diluted EPS, with diluted providing a more conservative and comprehensive view of earnings.
5 Types of EPS Explained
| Type | What It Measures | Best Used For |
|---|---|---|
| Reported (GAAP) EPS | Earnings calculated under standard accounting rules | SEC filings and regulatory comparisons |
| Pro Forma (Ongoing) EPS | Earnings from core operations, excluding one-time items | Forecasting future earnings potential |
| Retained EPS | Profits kept by the company after dividends | Analyzing reinvestment and growth strategy |
| Cash EPS | Operating cash flow per share | Assessing real cash generation |
| Book Value EPS | Equity value per share based on the balance sheet | Estimating liquidation value |
1. Reported EPS (GAAP EPS)
GAAP EPS follows Generally Accepted Accounting Principles and is what companies officially report in their SEC filings. It is the most standardized version, but it can sometimes be distorted by one-time charges or income that inflates or deflates the number.
2. Pro Forma EPS (Ongoing EPS)
Pro forma EPS strips out unusual items and focuses only on earnings from normal business operations. It helps analysts estimate what a company is likely to earn going forward. However, it does not always reflect real earnings, since each company can define “one-time” items differently.
3. Retained EPS
Retained EPS reflects the profit a company keeps rather than distributes as dividends. Many growing companies use retained earnings to pay down debt or fund expansion.
Retained EPS = (Net Earnings + Current Retained Earnings – Dividends Paid) / Total Shares Outstanding
4. Cash EPS
Cash EPS measures how much cash a company generates per share. Because it is harder to manipulate than accounting-based EPS, it is often preferred by analysts who want to see the real cash picture.
Cash EPS = Operating Cash Flow / Diluted Shares Outstanding
5. Book Value EPS
Book Value EPS calculates the average equity per share as shown on the balance sheet. It offers a static view of what each share would be worth if the company were liquidated today.
Real-Life EPS Examples
Apple (AAPL)
For fiscal year 2024, Apple reported net income of $93.74 billion. With diluted weighted average shares outstanding of 15.408 billion, the final calculation came to $93.74 billion divided by 15.408 billion shares, giving a diluted EPS of approximately $6.08 per share.
Nvidia (NVDA)
Nvidia reported an EPS of $11.93 in fiscal 2024. With a stock price above $800, its P/E ratio exceeded 65, a clear signal of high investor confidence in the company’s future growth.
Procter and Gamble (PG)
Procter and Gamble reported an EPS of $6.30 in 2025, reflecting stable income in a low-volatility consumer goods sector where steady EPS growth is common.
Target (TGT)
Target’s annual EPS for fiscal year ending January 2025 was $8.86, a slight decline of 0.89% year over year. In contrast, its 2024 EPS of $8.94 represented a 49.5% increase from the prior year, showing how sharply EPS can swing based on business conditions.
These real examples show why EPS should always be evaluated in context. A drop in EPS does not automatically mean a company is failing, just as a spike does not always mean it is thriving.
EPS and the P/E Ratio: How They Work Together
EPS and the price-to-earnings (P/E) ratio are closely connected. Once you have EPS, calculating P/E is straightforward:
P/E Ratio = Current Stock Price / EPS
EPS and P/E offer direct insight into financial strength and valuation. Rising EPS generally signals improving profitability, while P/E helps compare across companies. Pairing both creates a clearer picture for evaluating stocks.
| Scenario | What It May Signal |
|---|---|
| High EPS + Low P/E | Potentially undervalued stock |
| High EPS + High P/E | Strong growth expectations priced in |
| Low EPS + High P/E | Market betting on future growth |
| Negative EPS + Any P/E | Company is losing money; P/E becomes meaningless |
The trailing P/E ratio uses EPS from the past 12 months, while the forward P/E ratio uses earnings estimates for the next 12 months. There is no universal good P/E ratio; investors learn more by comparing a company’s P/E ratio to its own history, its sector peers, and the broader market.
Pros and Cons of Using EPS
Advantages of EPS
- Easy comparison across companies. EPS allows investors to compare companies of different sizes within the same industry on an equal footing.
- Tracks profitability over time. Steadily rising EPS over several years is a strong sign of business health.
- Dividend indicator. A growing EPS often leads to higher dividend payouts, which benefits long-term shareholders.
- Foundation for the P/E ratio. EPS is the base number used to calculate the P/E ratio, which is the most widely used stock valuation tool.
- Simple to find. Both net income and shares outstanding are publicly available in every company’s earnings report.
Disadvantages of EPS
- Easily manipulated. Companies can use accounting choices, stock buybacks, or one-time income classifications to make EPS look better than it is.
- Ignores cash flow. A company can report strong EPS while still struggling to pay its bills if actual cash generation is weak.
- Ignores share price. High EPS on a stock trading at $500 means something very different than the same EPS on a $10 stock.
- Negative EPS is hard to interpret. When a company posts a loss, EPS turns negative and most standard ratios like P/E stop working.
- Not useful across industries. A tech startup and a utility company will have very different EPS levels due to business model differences, not necessarily profitability differences.
What Is a Good EPS?
There is no universal “good” EPS number. What matters more is the trend and context:
- Is EPS growing year over year?
- Is EPS above or below the industry average?
- Is EPS growth coming from higher revenue or from reducing share count through buybacks?
A company that grows EPS mainly through stock buybacks (reducing shares outstanding) rather than actual profit growth may be less impressive than its numbers suggest. Always check the reason behind EPS changes.
How Investors Use EPS to Pick Stocks
Investors use EPS in several key ways: for investment analysis to compare profitability across companies, especially in the same industry; for financial reporting review since public companies must disclose EPS; and for performance tracking to monitor whether a business is growing profit per share or diluting it over time.
Experienced investors generally look for:
- Consistent EPS growth over three to five years
- EPS that beats analyst estimates each quarter (a sign of strong management)
- Low P/E paired with growing EPS (a classic value investing signal)
- Diluted EPS vs. basic EPS comparison to gauge potential dilution risk
Over 78% of S&P 500 companies beat consensus EPS estimates in Q1 2024, showing how closely the market tracks this metric.
EPS vs. Other Financial Metrics
| Metric | What It Measures | Used With EPS? |
|---|---|---|
| P/E Ratio | How much investors pay per dollar of earnings | Yes, directly |
| Revenue per Share | Total sales divided by shares | Yes, for margin context |
| Free Cash Flow per Share | Cash generated after capital expenses | Yes, to verify earnings quality |
| Dividend per Share | Cash paid to each shareholder | Yes, to assess payout sustainability |
| Book Value per Share | Net assets per share | Yes, for value investing |
No single metric tells the whole story. EPS is most powerful when used alongside cash flow data, revenue trends, and the P/E ratio.
Frequently Asked Questions
What does EPS mean in stocks?
EPS stands for earnings per share. It tells you how much profit a company earns for every share of common stock. A higher EPS generally means the company is more profitable.
Is a higher EPS always better?
Not always. A high EPS is positive, but context matters. Check whether earnings are growing from real business activity or from one-time events and buybacks.
What is the difference between basic and diluted EPS?
Basic EPS uses only current shares outstanding. Diluted EPS includes all potential shares from stock options and convertible securities, giving a more conservative estimate.
Can EPS be negative?
Yes. When a company reports a net loss, EPS turns negative. Negative EPS makes the P/E ratio meaningless and signals the company is spending more than it earns.
How often is EPS reported?
Public companies report EPS quarterly (every three months) and annually as part of their earnings releases. The SEC requires EPS disclosure in all 10-Q and 10-K filings.
What is a good EPS for a stock?
There is no fixed answer. A good EPS is one that grows steadily over time, exceeds industry peers, and beats analyst expectations. Compare a company’s EPS to its own historical range first.
How does EPS affect dividends?
A growing EPS gives companies more room to increase dividends. Many companies set a target payout ratio based on EPS. If EPS drops sharply, dividends may be cut.
What is the difference between EPS and P/E ratio?
EPS measures profit per share. The P/E ratio divides the stock price by EPS to show what investors are paying for each dollar of earnings. EPS is the input; P/E is the valuation output.
How can companies manipulate EPS?
Companies can boost EPS by buying back shares (reducing the denominator), classifying regular costs as one-time items, or using aggressive revenue recognition. This is why cash EPS and operating cash flow should also be reviewed.
Where can I find a company’s EPS?
EPS is disclosed in a company’s quarterly earnings press release, on its investor relations page, in SEC filings (10-Q and 10-K), and on financial data sites like Yahoo Finance, Morningstar, and the SEC’s EDGAR database.
Similarly, You May Also Like:
- Bank Reconciliation Statement(BRS) – Meaning, Features, Advantages and Disadvantages | Accounting
- Process Costing – Meaning, Features,Types, Advantages and Disadvantages | Accounting

MBA- Finance Specialization
I am Smirti Bam, an enthusiastic edu blogger with a passion for sharing insights into the dynamic world of business and management through this website.
I hold a MBA degree from Presidential Business School, Kathmandu, and a BBA degree with a specialization in Finance from Apex College,
- Onboarding Vs. Orientation: Key Differences, Benefits, Process & Best Practices | Human Resource Management (HRM) - September 24, 2026
- Moonlighting Vs Freelancing: Meaning, Differences & Risks Explained | Human Resource Management (HRM) - September 14, 2026
- Employee Retention Vs. Employee Engagement: Key Differences Explained | Human Resource Management - September 6, 2026


